Monitoring
The Monitoring Module provides a set of dashboards designed to track and evaluate the health, performance, and stability of deployed machine learning models, as well as the consistency of input data. It enables proactive identification of issues such as data drift, infrastructure bottlenecks, or performance degradation, ensuring that models remain reliable in production environments. The lack of monitoring in a system may cause the model or the surrounding infrastructure to fail because of poor input data structure or loss of service because of load failure, poor outputs because of declining accuracy because of change of input data compared to training pipeline etc.
Dashboard Overview
The module includes multiple dashboards, each focused on a specific aspect of monitoring:
- Infrastructure Dashboard – Tracks the infrastructure metrics associated with the platform deployment. This includes compute usage, memory consumption, and other operational indicators essential for maintaining system stability.
- Categorical Target Drift Dashboard – Monitors changes or drifts in the distribution of categorical target label values. This helps detect shifts in the type or frequency of predicted categories over time.
- Classification Performance Dashboard – Evaluates the performance of classification-based machine learning models by tracking metrics such as quality and confusion over time.
- Data Drift Dashboard – Identifies statistical changes in numerical input features processed through data pipelines. This is critical for detecting deviations between the training data distribution and new incoming data.
- Image Drift Dashboard – Detects changes in the statistical properties of image datasets processed in the pipelines, ensuring that models trained on visual data remain relevant to current input patterns.
- Numerical Target Drift Dashboard – Tracks changes in the distribution of numerical target label values, ensuring the model’s predictive targets remain consistent with training expectations.
- Regression Performance Dashboard – Measures the accuracy and reliability of regression-based machine learning models, using metrics such as RMSE (Root Mean Squared Error), MAE (Mean Absolute Error) etc.
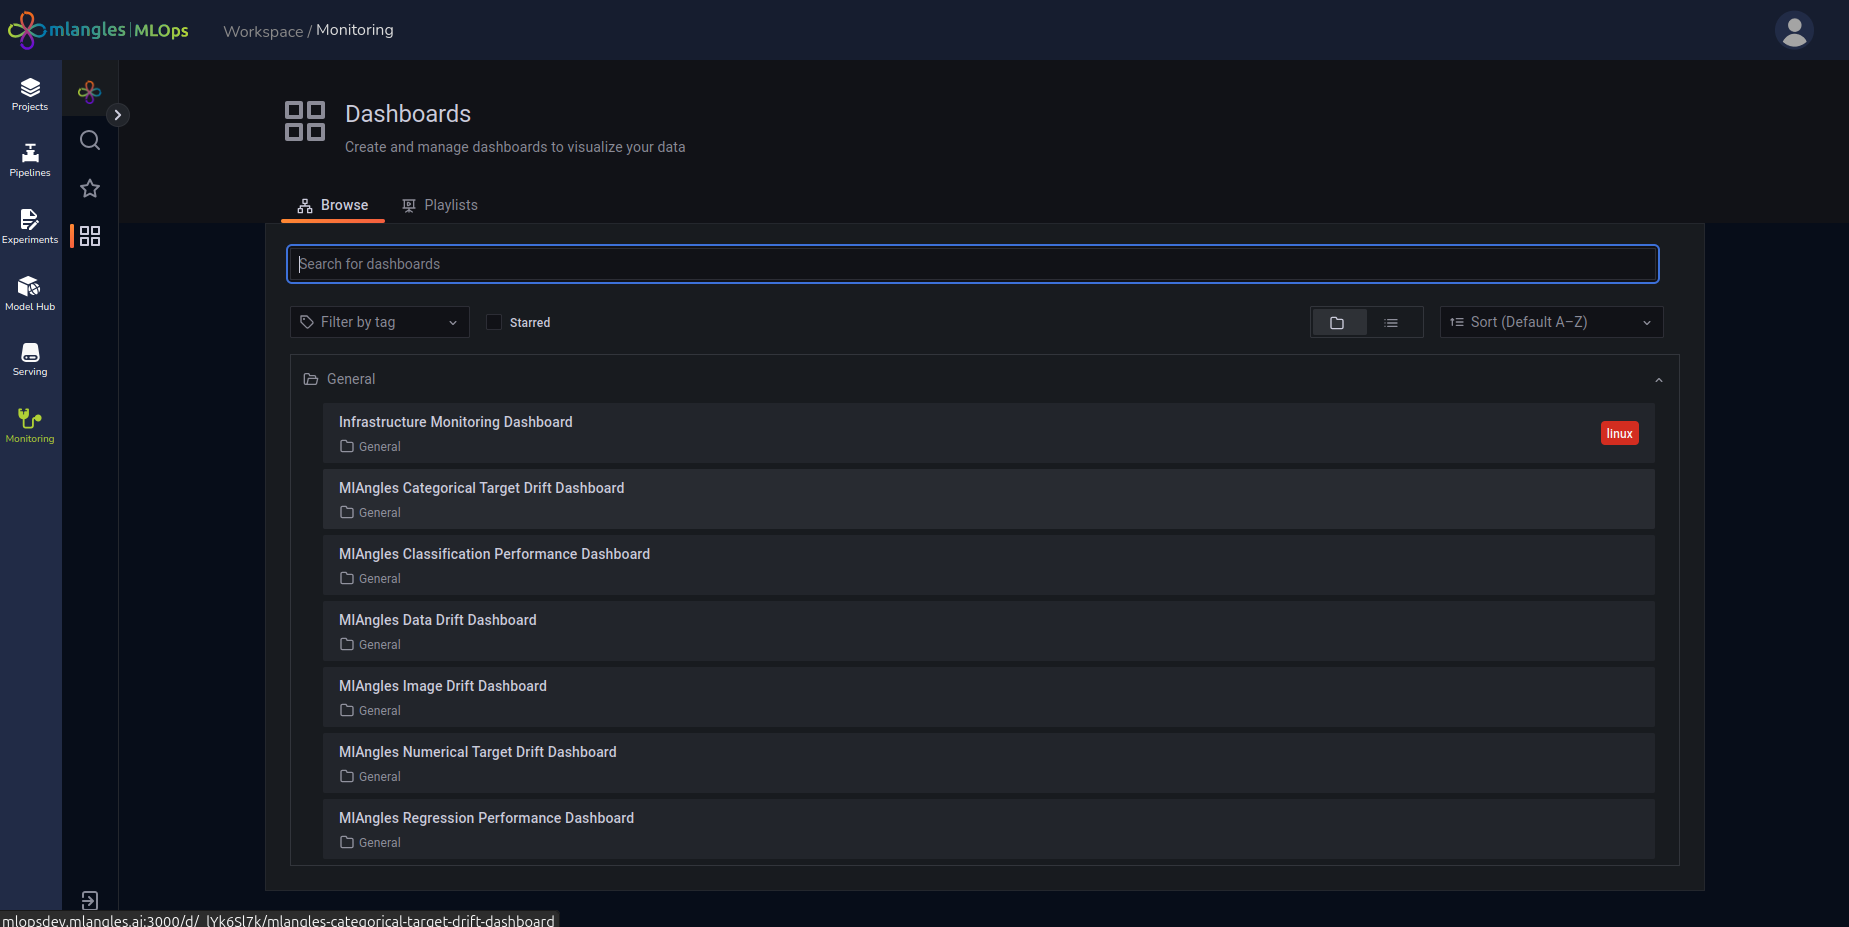
Figure 23 – Monitoring Dashboard
Monitoring Process
When a model is deployed, the platform automatically stores its relevant details in a JSON configuration file. From this point onward, drift monitoring begins by using the original training data as a reference baseline.
When a new execution of the same pipeline (used to train the deployed model) is completed, the resulting cleaned data is compared against the baseline training data.
If significant drift or inconsistencies are detected, they are reported through the corresponding dashboard, allowing users to take corrective action such as retraining the model, adjusting preprocessing steps, or investigating anomalies in data sources.
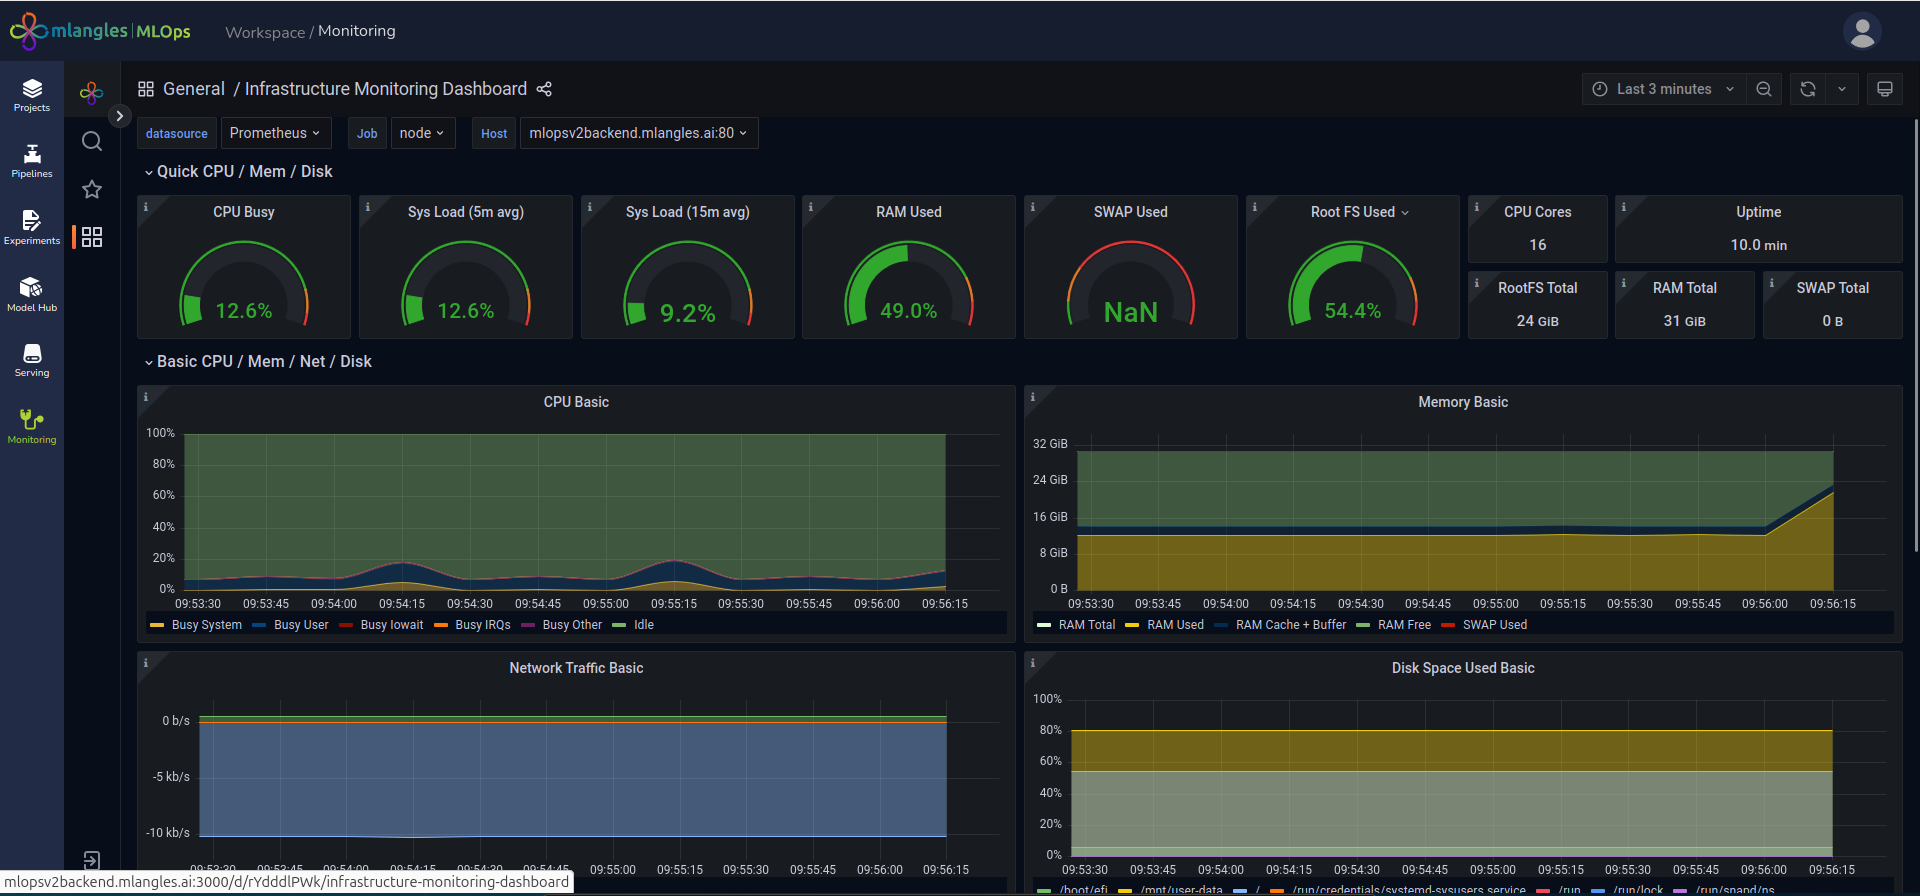
Figure 24 – Infrastructure Dashboard
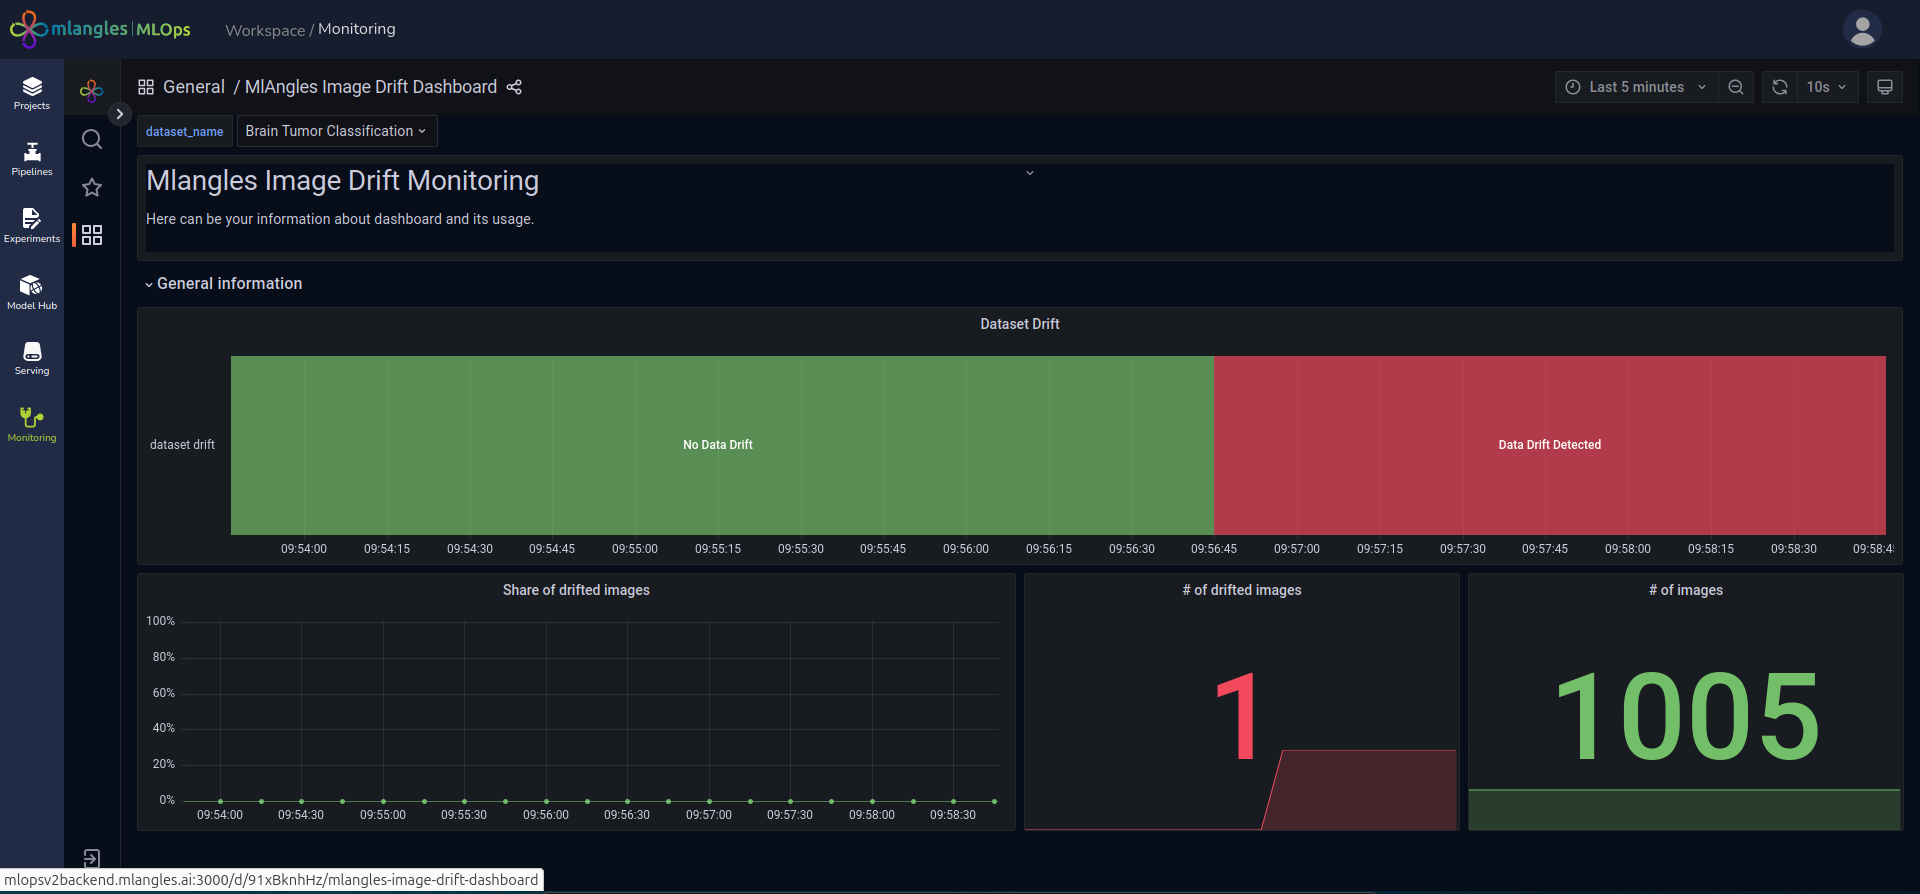
Figure 25 – Image Drift Dashboard
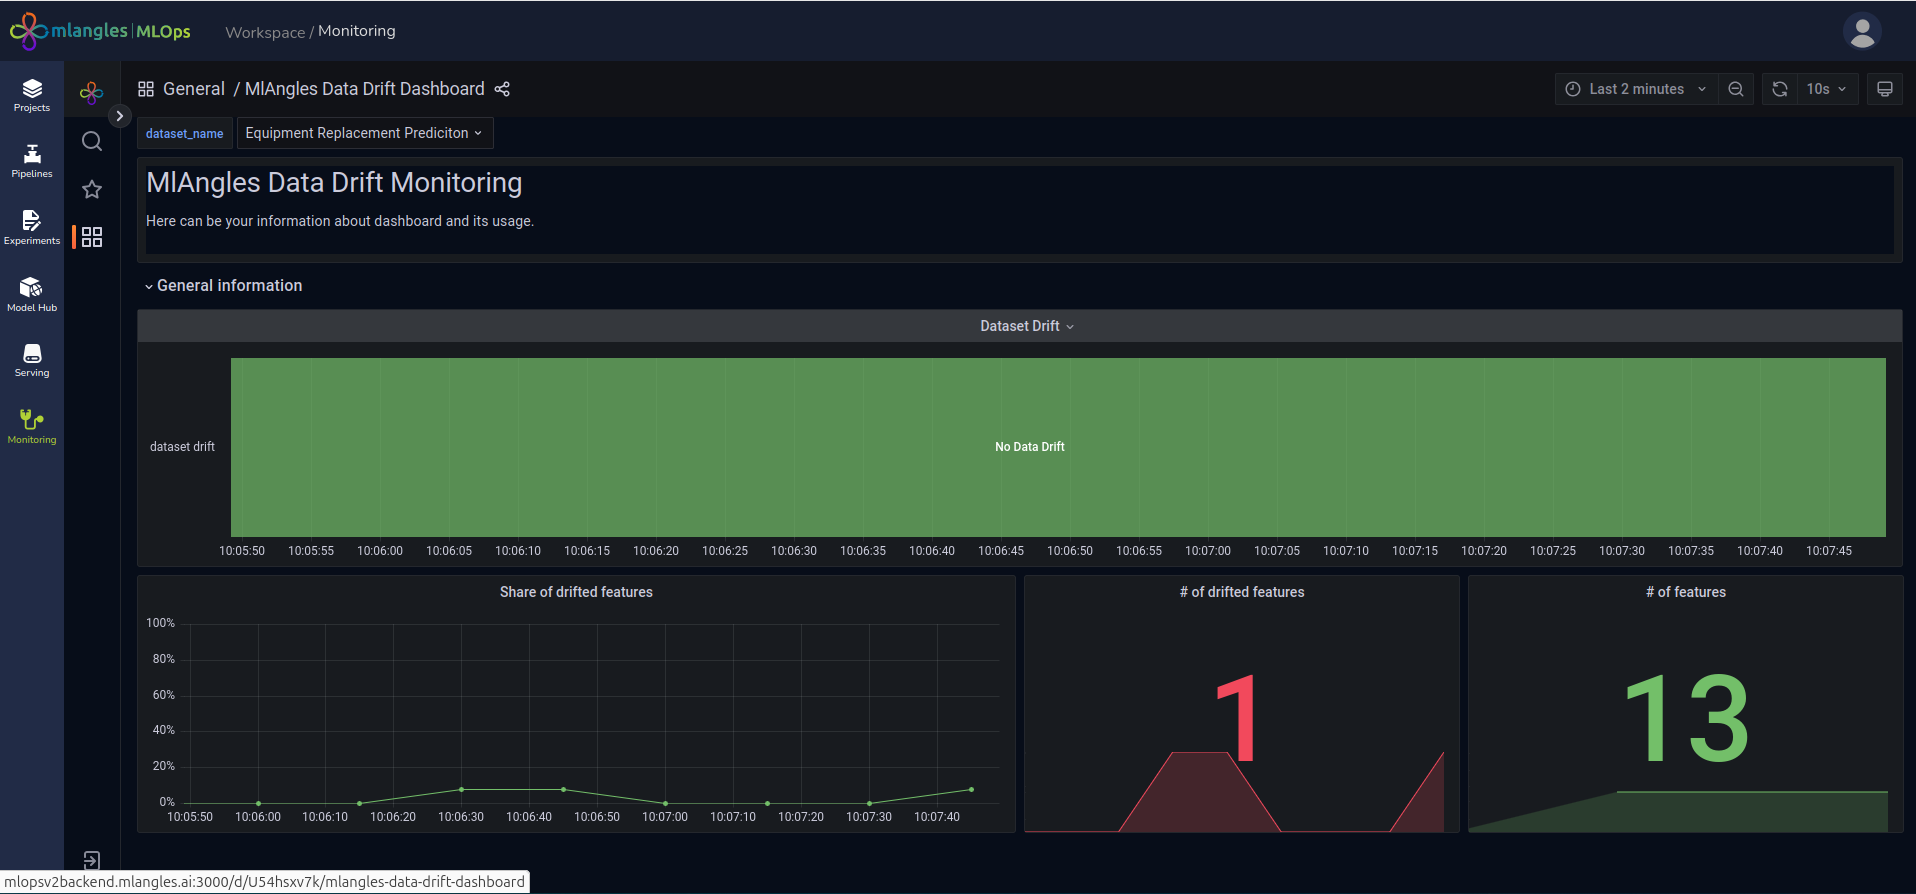
Figure 26 – Data Drift Dashboard
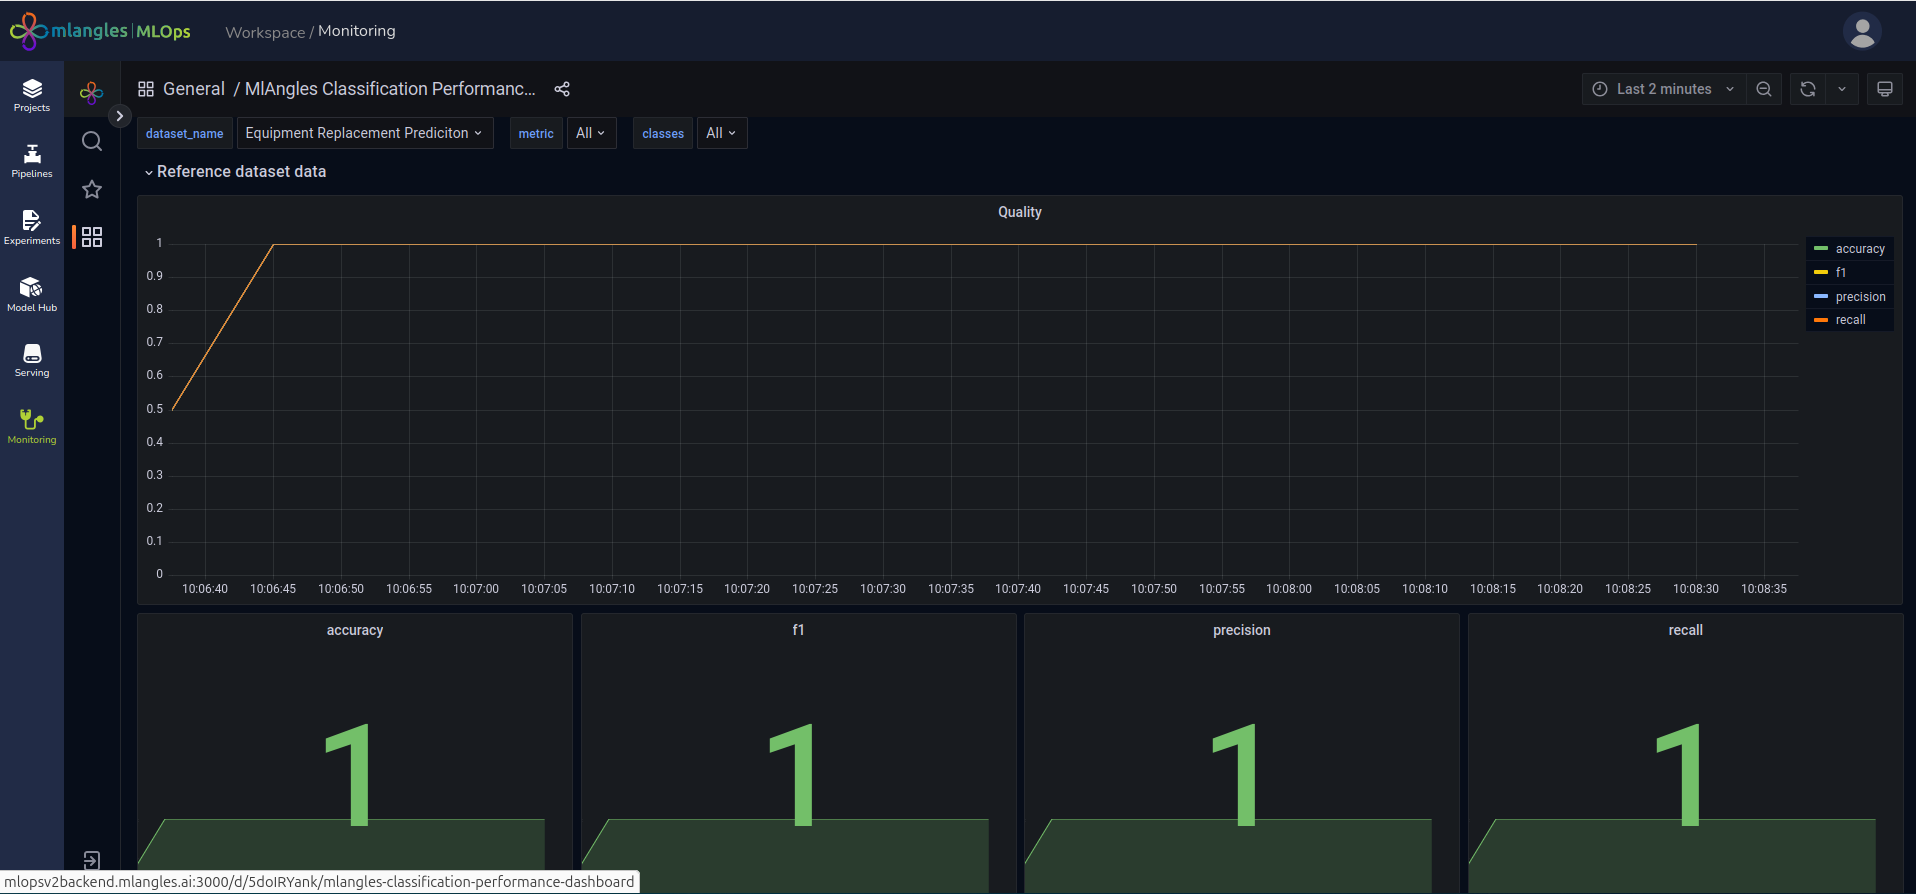
Figure 27 – Data Drift Dashboard